A Reversible Beverage at ZL3IX
1 Introduction.
Firstly, let me point out that there is nothing at all original in this account of one of my remote Beverages. I am simply documenting my understanding of the theory presented in available material, as there are some design parameters that are not particularly well explained. I will also detail some measurements that I made.
A reversible Beverage uses the orthogonality between common mode and differential mode currents on a 2-wire line to provide independent reception of signals originating from both ends. (In this context, I use the word “orthogonality” meaning “independence of each other”, rather than in phase quadrature). In the diagram below, consider what happens for a wave arriving from the right (call this the forward direction). It will induce equal in-phase currents on the two wires, which will be summed on the secondary of T1, and appear at its centre tap. The combined current produces a signal at the primary of T2. This is the common mode signal.
In contrast, a wave arriving from the left (the reverse direction) will also induce equal in-phase currents on the two wires, which will be summed at the secondary of reflection transformer T3, and appear at its centre tap. The centre tap is connected to the primary of T3, the other side of which is grounded. By transformer action, the current in the primary produces a differential mode current in the secondary, which then travels back along the line to T1. Since the currents so produced are in anti-phase, they will produce a signal at the primary of T1. This is the differential mode signal.
Thus signals arriving from left and right are available individually at the common mode and differential mode connectors respectively.
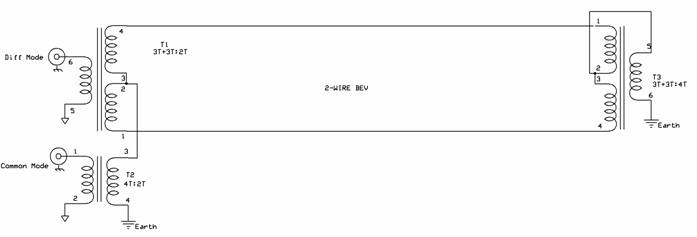
General Schematic of 2-Wire Beverage
2 Levels of Wanted Signals.
2.1 Forward.
There is little that can go wrong to reduce the level of the wanted forward signal significantly. Attenuation along a lossy line may have a small effect, and a poor ground connection at the feed end may reduce the signal by a dB or two, since the ground loss forms a potential divider with the common mode characteristic impedance.
2.2 Reverse.
The level of the reverse direction signal will be affected more by line attenuation than that of the forward direction signal, since the signal has to traverse the line twice. Lines with a significant loss, such as some samples of WD1-A, may make a noticeable difference. Any loss in the ground connection at the reflection transformer forms a potential divider with the common mode line impedance, and can also contribute to signal loss.
3 Levels of Unwanted Signals.
3.1
Reverse Direction Signals
Appearing at the Common Mode Port
The forward F/B ratio can be degraded by the following implementation imperfections:-
- Imperfect turns balance in the split windings of T1 or T3
- Incorrect transformation ratio at reflection transformer T3
- Uncompensated ground connection loss resistance at reflection transformer T3.
- Imperfect termination of the differential mode port.
- Unequal pickup between the each wire of the 2-wire line.
3.1.1 Imperfect Turns Balance.
This really should not be a problem at 1.8 MHz, with transformers wound on ferrite binocular cores. My transformers are wound on FairRite 2873000202 cores, and have better than 30 dB turns balance. The following figures show some measurements I made with my transformers.
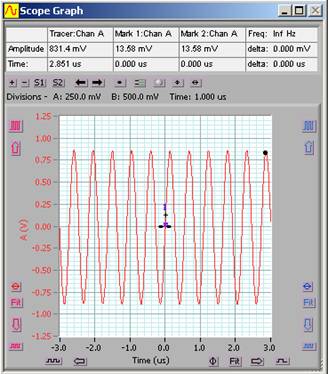
Feed CT of T1,
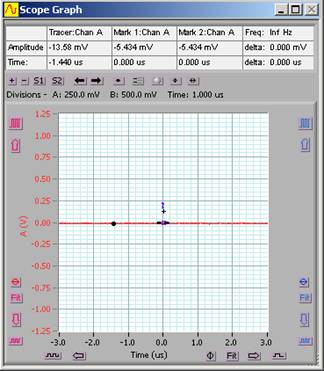
In the both the scope traces above, the centre tap of T1 is fed with signal. The left hand trace shows the signal appearing at the common mode output, while the right hand trace shows the signal appearing at the differential mode output.
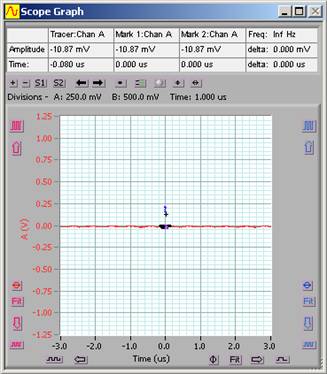
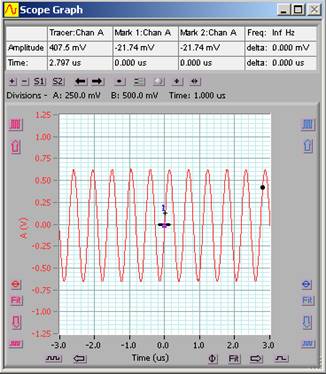
Feed T1 Sec, CM Output Feed T1 Sec, DM Output
In the both the scope traces above, the secondary of T1 is fed with signal. The left hand trace shows the signal appearing at the common mode output, while the right hand trace shows the signal appearing at the differential mode output.
In both of the feed arrangements, the ratio of wanted to unwanted signal is more than 30 dB
3.1.2 Incorrect Transformation Ratio at Reflection Transformer T3.
The reflection transformer needs to match
the common mode to differential mode line impedances. I designed my Beverage to have a common mode
impedance of 320 Ω and a differential mode impedance of 720 Ω. The impedance ratio is thus 2.25 :1, and can be matched with a transformer having a 3:2
turns ratio, neglecting ground loss effects.
If there
is a mismatch at this point, not all of the common mode signal will be
converted to differential mode. A
portion will be reflected back as a smaller common mode signal, and will be
detected at the common mode connector, thus affecting the F/B ratio.
3.1.3 Uncompensated Ground Connection Loss Resistance at Reflection Transformer T3.
This is really a variation of 3.1.2 above. The turns ratio of T3 needs to be modified to take into account the ground connection resistance, normally leading to a reduced turns ratio.
3.1.4 Imperfect Termination of the Differential Mode Port.
This is quite a subtle cause of degraded
F/B ratio. If the differential mode port
is incorrectly terminated, the following will happen. A wave arriving from the reverse direction
induces a common mode current that is converted to differential mode at the
reflection transformer. The differential
mode signal travels back along the line, but is not completely absorbed in the
load. A portion of it is therefore
reflected back along the line, to be converted once more into a common mode
signal by the reflection transformer, and travels back down the line again, to
be detected at the common mode port. In
total 4 traverses of the line, and 3 reflections, are involved in this
mechanism. The 2nd of these
reflections is, of course, the one that should not take place.
3.1.5 Unequal Signal Pickup Between the Wires.
If the reverse wave induces unequal signal levels in the 2 wires, a differential mode component will result. This will be converted to a common mode signal by the reflection transformer, and will appear at the common mode port, thus degrading the forward F/B ratio.
For horizontally arranged lines made from identical wires the signal pickup should be the same on each. Even for vertically arranged wires, provided the wire spacing is small compared with the height above ground, I would expect the difference in pickup to be small. A 1 dB difference would be quite large, and this will produce an unwanted signal 20 dB down on the forward direction common mode component.
3.2
Forward Direction Signals
Appearing at the Differential Mode Port
There are 2 possible implementation imperfections that can degrade the reverse F/B ratio:-
- Incorrect termination of the common mode port
- Imperfect turns balance in the split windings of T1
3.2.1 Incorrect Termination of the Common Mode Port.
If there is a mismatch at this port, common mode currents due to signals arriving from the forward direction, will be reflected back along the line. They will be converted to differential mode by the reflection transformer, travel back down the line, and produce unwanted signals at the differential mode port. In total 3 traverses of the line and 2 reflections are involved in this mechanism. The 1st reflection is the one that should not take place.
3.2.2 Imperfect Turns Balance.
This should not be a problem, as discussed under forward F/B ratio in paragraph 3.1.1.
3.3 Other Unwanted Coupling Mechanisms.
3.3.1 Coupling From Other Structures.
The only other structure in close proximity to my 2-wire Beverage, is the galvanised wire fence whose supports it shares. At the start of this project I was unsure of the magnitude of the effect that the fence would have, and the opinions of other Beverage users vary considerably. Some experimenters have stated that such a fence has minimal effect, and I hoped that this would also be true in my case.
When my initial F/B measurements yielded
less than satisfactory results I was forced to investigate the matter
further. See the section on measurements
for further details.
4 My Design Iterations.
4.1 The Antenna Wires and Supports – Initial design.
In order to avoid problems with excess attenuation, I decided to employ an open 2-wire line, rather than a twisted pair such as WD1-A. I was lucky to have an existing fence available for the entire run of the 2-wire Beverage, and supporting the wires above the fence was quite a simple matter. I simply drilled a 9 mm hole in the top of every 2nd fence post, and inserted a 300 mm section of cheap garden stake. These 9 mm diameter stakes are available in various lengths from gardening shops. I cut 200 mm lengths of 6 mm round fibreglass rod, and drilled a 2.5 mm hole 10 mm from each end. I used a pair of cable ties to attach the rod to the top of the stake. I threaded a 2.5 mm cable tie through each of the holes, and enclosed it around the wire. Using this attachment method, the wire is constrained to sit on top of the rod, at a fairly tightly controlled spacing, while free to move through the cable tie in the longitudinal direction. This was for ease of tightening.
Photo 1 shows this original arrangement.
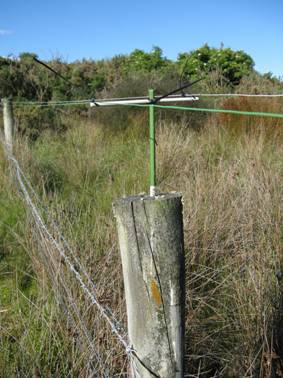
Photo 1
The height of the pair above ground is 1.2 m, and the spacing 180 mm. The wire diameter is 0.6 mm.
From the formula Zdiff = 276 log10
(2S/d), the theoretical differential mode impedance is 766 Ω
From the
formula Zcom = 69 log10 (4h/d √(1
+ (2h/S)2)), the theoretical common mode impedance is
347 Ω.
(Note
that earlier editions of ON4UN’s book and the ARRL Antenna Book,
have this formula incorrectly quoted.)
The
ratio of these impedances is 2.2:1, very close to the convenient figure of
2.25:1 given by a 3:2 turns ratio in the reflection transformer.
Unfortunately,
I forgot to take account of the unavoidable addition of ground connection
resistance loss which is in series with the grounded winding of the reflection
transformer. Assuming approximately
80 Ω loss resistance, the turns ratio should
have been more like 1.7:1, rather than 1.5:1.
4.2 Design Modified for Increased Height.
After some unexpected results for the common mode transmission loss, and finding a poor F/B ratio, I decided to increase the height of the wires to 2.5 m above ground. This was achieved using 1.5 m lengths of light bamboo inserted into the holes in the fence posts.
The bamboo is likely to be less robust than the sections of garden stake. It will be replaced with something stronger, if the increased height improves the performance of the antenna, but the bamboo is found to be too weak.
At 2.5 m height the theoretical figure
for Zcom is 390 Ω. Conveniently, this is
more closely matched by the 2.25:1 transformer when the likely ground
connection resistance is taken into account.
4.3 Feed and Switching Box.
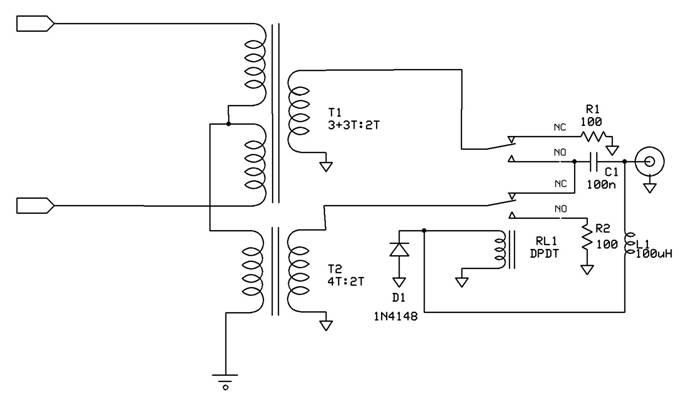
The schematic of the feed and switching box is shown above.
T1 and T2 are the differential mode and
common mode coupling transformers respectively, and RL1 switches the output
between them. RL1 is energised from the
coax line, 0 V for forward, and +12 V for reverse. The inactive winding is switched to a matched
load in each case. With lossless
transformers, the loads would be 82 Ω, but the high
permeability binocular cores used, do have a significant parallel loss
resistance (about 500 Ω). R1 and R2 have therefore
been increased in value so that the total parallel load is about 82 Ω.
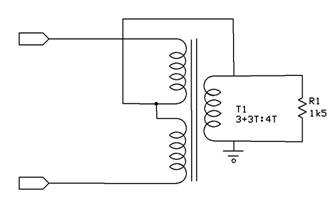
4.4 Reflection Transformer.
The schematic for the reflection transformer is shown below. T1 has an impedance transformation ratio of 2.25:1. It collects the common mode currents arriving from the Beverage reverse direction, matches the common mode line impedance to the differential mode line impedance, and re-launches the signal in differential mode. The purpose of R1, is to add a small shunt load across the transformed differential mode impedance. The parallel combination so obtained, added to the measured ground connection resistance, equals the common mode impedance of the line, and results in minimum reflection in this mode. If this step were not taken, the error described in 3.1.3 would result.
The addition of R1 does result in a small loss, probably about 1 dB. Alternative ways to compensate for the ground connection resistance, would be either to modify the turns ratio of T1 slightly, or to add a second transformer. T2, between the centre tap of T1 and the coupling winding. In practice, changing the turns ratio of T1 would not be easy, as 3.5 T would be needed for the coupling winding. I am suspicious of half turns used on binocular cores, as the balance may be affected.
Adding a second transformer would be likely to result in a similar loss, since the high permeability cores used, do have residual parallel resistance.
Later note – R1 was omitted after increasing the height of the antenna, as the match provided by the reflection transformer alone, was then close enough.
5 Measurements Made.
The first set of measurements was made using my N2PK Vector Network Analyser (VNA). The VNA was swept from1.4-2.4 MHz.
5.1 Line Differential Mode Impedance.
For this measurement, the VNA was used in
Reflection Mode, with a 9:1 coupling transformer between it and the 2-wire
line. A 1 kΩ pot was connected across the far end
of the line, and adjusted for the best impedance flatness. Photo 2 below shows a mismatched case. There are larger variations in both the real
and imaginary parts of the impedance, as the VNA frequency is swept.
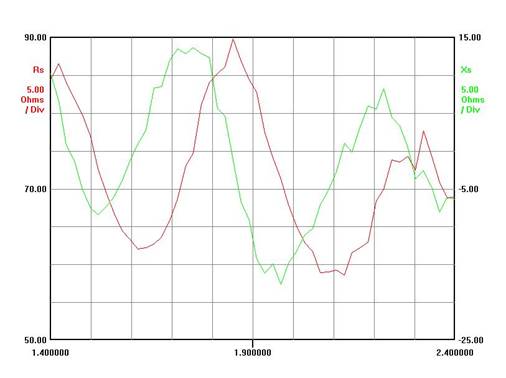
Photo 2
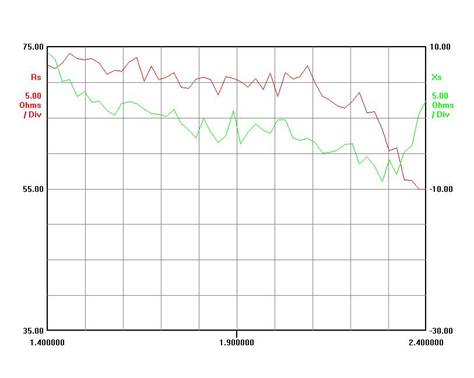
Photo 3
below shows the matched case.
Photo
3
The
matched case is when the far end termination was 760 Ω, which is
therefore the differential mode impedance.
This value is very close to the theoretically predicted value for the
2-wire line. Note that the actual value
of the impedance measured by the VNA at 1.8 MHz is about
72 Ω. Referred to the high Z
side of the 9:1 transformer, this is 648 Ω. The coupling transformer itself has an
equivalent parallel loss resistance of 4500 Ω, however. Taking this into account, the corrected value
for the impedance is 757 Ω.
5.2 Line Common Mode Impedance.
The VNA was again used in Reflection Mode. The 2-wire line was shorted together at the feed end, and fed against ground. The far end of the wires were also shorted, and pot placed between the common point and ground. The pot was again adjusted for best flatness.
In this test, the pot value had very little influence on the impedance seen at the feed end, suggesting that there is a significant transmission loss associated with common mode transmission. The feed impedance was close to 360 Ω regardless of the pot setting. Photo 4, below, shows the impedance plot.
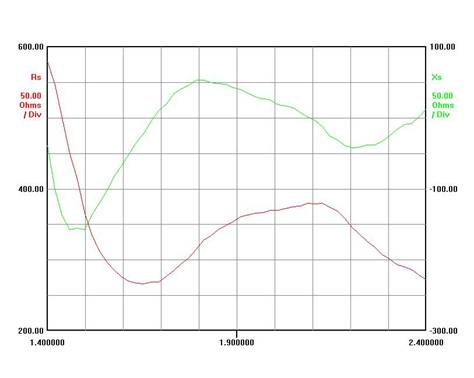
Photo 4.
Although the real part of the impedance is
close to the 360 Ω
theoretical value at 1.8 MHz, there is
considerable variation across the band.
This plot was taken when the wire were close to the fence, which may be
influencing the results. The measurement
was not repeated after raising the antenna to its new height.
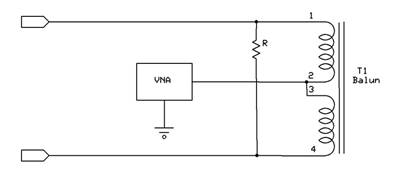
5.3 Common Mode Match Provided by Reflection Transformer.
For this test, the VNA was again used in Reflection Mode. Its measurement port was connected between the centre tap of a feed balun and ground. A termination resistor, equal in value to the measured differential characteristic impedance of the 2-wire line, was connected across the balun. The far end of the line was terminated with its reflection transformer, as for normal operation. The schematic of the measurement arrangement is shown below.
As for the common mode impedance measurement, the results of this test were inconclusive.
5.4 Total 2-Way Line Loss.
For this test, the VNA was used in Transmission Mode. Its output port was connected between the common mode port of a substitute feed transformer and ground. Its input port was connected to the differential port of the transformer, as shown in the schematic below.
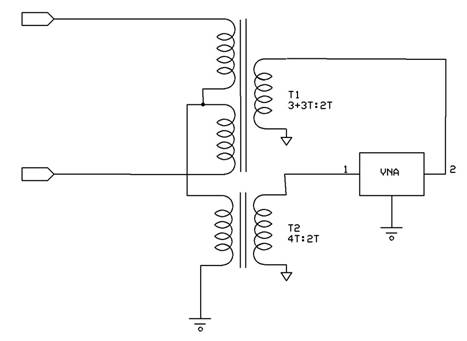
Photo 5 shows the swept insertion loss, which is close to 10 dB. Either the forward or reverse path therefore has significant loss (or both) From the common mode impedance measurement, it is likely that the forward path has the dominant loss.
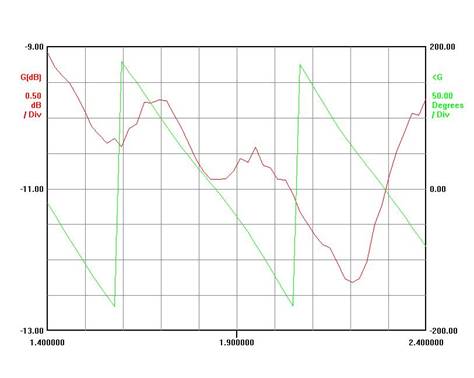
Photo 5.
5.5 One Way Loss – Differential and Common Mode.
After finding such a large 2-way loss, it was decided to separate out the common mode and differential mode loss. For this measurement a crystal controlled source, attenuator, and measurement receiver were used. The source has an output of about +13 dBm, so its output was attenuated by 40 dB to avoid overload of the measurement receiver. The source was coupled into the line using a 9:1 transformer.
First the source was connected to the feed box, in both common and differential modes, and a reference level noted for each of these modes. For interest, the cross mode coupling was also noted, and was found to be better than ‑50 dB. The source was then moved to the far end of the antenna, and again connected in both common and differential modes. The results were that the differential mode transmission loss is 1.3 dB, and the common mode loss 7.8 dB. These values confirm earlier suspicions that the common mode loss is larger than was expected.
For comparison, the loss of a single-wire 2 wavelength Beverage in the same area, was measured, and found to be 4 dB. The single-wire antenna is well away from any other wires, and its height is 3 m above ground.
Possible reasons why the transmission loss was higher than for the single-wire antenna, were not immediately apparent. Possibilities are
· that energy couples into the galvanised fence over which the Beverage is mounted.
· the density of ground currents is higher for the lower antenna, leading to greater loss.
The common mode transmission loss measurement was repeated after the antenna height had been increased to 2.5 m, and was found to have decreased to 4 dB, identical to that of the single-wire Beverage. This is a good result, but from the measurement alone, the reason for the change cannot be determined with certainty. Unfortunately the antenna modelling program EZNEC (of which I have a copy), cannot simulate ground losses without licensing NEC4, which is expensive and not freely available.
Without further evidence my suspicion is that the reduced the current density in the ground is what makes the difference.
5.6 Coupling From the Fence.
A further measurement was undertaken, after finding the F/B ratio to be poor (see Radiated Measurements in the next section). As a variation on the common mode transmission loss measurement, the signal source was connected to the top strand of the fence at the far end, instead of to the antenna itself. The run of that section of fence is only 100 m. Another section runs for the remaining 200 m, but is not connected to the far end fence.
With the antenna at the original height of 1.2 m the signal coupled into the antenna from the fence wire, was only 20 dB down on the level of the directly coupled signal. It can be speculated that the coupling would be even worse from the 200 m length of fence. I did not measure the latter, as I was anxious to avoid common impedance coupling due to the shared grounds between the source and load at the feed end, which would have given overly pessimistic results.
I re-measured the coupling from the
100 m wire after the antenna height had been increased to 2.5 m
(1.6 m above the fence) and found that it had been reduced by a further
8 dB, which was encouraging.
6 Radiated Measurements.
An estimate of the F/B ratio of the antenna, in both forward and reverse mode, was made, using the crystal controlled source and a small loop antenna. The loop antenna was set up at two locations, approximately 4.5 km from each end of the Beverage, and along its line of fire. At each location, the signal strength was noted on the measurement receiver.
6.1 Antenna at 1.2 m Height
The levels recorded were as follows.
|
|
Source NNE |
Source SSW |
|
NNE Signal Strength (dBm) |
-108 |
-112.5 |
|
SSW Signal Strength (dBm) |
-113 |
-102.5 |
|
Average Signal Strength (dBm) |
-110.5 |
-107.5 |
For each location, the average signal strength was calculated. The difference of the averages was assumed to be attributable to a difference in propagation loss between the 2 test sites and the Beverage antenna. This difference was then added to the signal strengths measured from the location giving the lowest signal strengths, in an attempt to remove the effects of propagation.
The new results were then
|
|
Source NNE |
Source SSW |
|
NNE Signal Strength (dBm) |
-105 |
-112.5 |
|
SSW Signal Strength (dBm) |
-110 |
-102.5 |
The F/B ratio for the antenna pointing NNE was then calculated as -105 – (-112.5) or 7.5 dB.
The F/B ratio for the antenna pointing SSW was then calculated as -102.5 – (-110) also 7.5 dB.
These results are not good. None of the error mechanisms discussed in Section 3 would be serious enough to give results as bad as this.
6.2 Antenna at 2.5 m Height.
After rasing the height of the antenna to 2.5 m, the levels recorded were as follows.
|
|
Source NNE |
Source SSW |
|
NNE Signal Strength (dBm) |
-105.5 |
-120 |
|
SSW Signal Strength (dBm) |
-114 |
-98.5 |
|
Average Signal Strength (dBm) |
-109.8 |
-109.3 |
On the occasion, the averages were only 0.5 dB different, but the results were again corrected, to maintain consistency with the first set of tests.
|
|
Source NNE |
Source SSW |
|
NNE Signal Strength (dBm) |
-105 |
-120 |
|
SSW Signal Strength (dBm) |
-113.5 |
-98.5 |
The F/B ratio for the antenna pointing NNE was then calculated as -105 – (-120) or 15 dB.
The F/B ratio for the antenna pointing SSW was then calculated as -98.5 – (-113.3) also 15 dB.
These results are much better. I assume that the reduced coupling from the fence has made the difference. With 15 dB F/B ratio, the degradation suffered by the receive directivity factor (RDF) will only be only 0.14 dB.
7 Conclusions.
· For a 2-wire Beverage the differential and common mode impedances estimated from the published formulae, are reasonably accurate.
· Provided that the correct terminations for the unused mode are applied in the feed box, the correct transformation ratio is used for the reflection transformer, and that the antenna is well away from other conductors, a useful F/B ratio in both directions, can be obtained from the bi-directional design.
· It is speculated that the common mode transmission loss of any Beverage antenna (single wire or 2-wire) can be quite high if the antenna is close to the ground. The higher this loss, the less effect there will be from making the antenna longer. For a 2-W/L antenna with 8 dB loss as found for the 1.2 m high antenna, the RDF (receive directivity factor) would be considerably lower than predicted by a simple simulator such as EZNEC. There may not be much point in the antenna being 2 W/L long, in the first place. Keeping the transmission loss low (speculatively by increasing its height) is very desirable. This observation has nothing to do with the signal level observed at the feed connector, as there is more than enough signal to overcome the front end noise of all but the deafest of receivers. It has to do with the directivity of the antenna.
8 Acknowledgements.
· Many thanks to Rod Mackintosh ZL3NW, for the many hours he spent assisting with the various measurements described in the preceding paragraphs. Several of these would have been impossible without his help. Rod has also provided valuable assistance with the erection of the other antennas at my remote site.
·
Thanks also to John Rogers
G3PQA, who inspired me to try out a 2-wire Beverage, and for many e-mail
discussions about how they operate and perform.